


In the latest issue of the Journal of the American Planning Association, three researchers utilized the current COVID-19 pandemic as a case study to investigate the relationships between densely populated areas and the spread of disease.
By studying the direct and indirect impacts of population density on infection and mortality rates for 913 U.S. metropolitan counties, researchers found that while metropolitan population is one of the most significant predictors of infection rates, larger metro areas also have higher infection and mortality rates.
Interestingly, the findings show that “counties with higher densities have significantly lower virus-related mortality rates than do counties with lower densities, possibly due to superior health care systems.”
In Oklahoma, the mortality rates in six of the ten most densely populated counties is lower than the state mortality rate (Tulsa, Oklahoma, Canadian, Rogers, Payne, and Comanche counties).
Overall, case rates follow the opposite pattern, with higher than expected rates for populations in both Oklahoma City and Tulsa metropolitan statistical areas.
Oklahoma City metro’s share of total cases is 0.79% more than their population share indicates, while just Oklahoma County itself has over 4% more cases than would be expected.
The same pattern emerges in Tulsa, with 6.55% more cases than their population share, and 8.6% when factoring for just Tulsa County. The Oklahoma City metro accounts for 36.4% of statewide cases, with the Tulsa metro making up 31.8% of cases. Together, while they account for only 60.8% of the state population, they have 68.2% of cases.
The data in Oklahoma suggests that there is a correlation both between higher rates of infection in less densely populated areas and lower rates of mortality due to infection, likely related to access to health care and other socioeconomic factors.
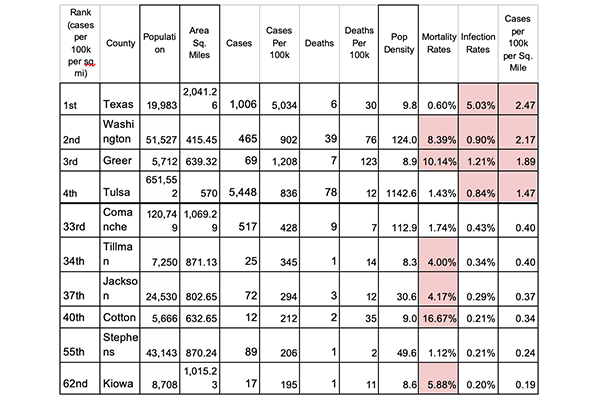
When controlling for population density, we find the major hotspots around Oklahoma.
Texas County, which saw an outbreak in mid-May and has experienced declining new cases since, currently has 2.47 cases per 100,000 residents per square mile, the highest of any county in Oklahoma. Texas County also has the highest infection rate, at 5% or 1 in 20 residents testing positive for COVID-19.
Washington, Greer, Tulsa, Ottawa, Choctaw, Adair, McClain, and McCurtain counties all have more than 1 case per 100,000 residents per square mile. Statewide, there are 0.47 cases per 100,000 residents per square mile.
All of Southwest Oklahoma has lower rates than the statewide average, with Comanche County at 0.4, Tillman at 0.4, Jackson at 0.37, Cotton at 0.34, Stephens at 0.24, and Kiowa at 0.19 equivalent cases per square mile.