

OKLAHOMA CITY – A recent report that ranked Oklahoma fourth highest in the nation for structurally deficient bridges almost certainly referred to county bridges across the state.
An in-depth analysis issued last year by the Legislative Office of Fiscal Transparency (LOFT) reported that:
Oklahoma has 23,138 bridges: 13,595 (almost 59% of the total) on county roads; 6,737 (a little over 29%) on the state/federal highway system and non-toll interstate highways; and approximately 870 (slightly less than 4%) on state turnpikes. The other 1,900-plus are located in cities and towns, in state parks, on railroads, on federal property and elsewhere.
Of Oklahoma’s 77 counties, only Roger Mills County had no structurally deficient bridges in Fiscal Year 2019.
Despite infrastructure improvements under the County Improvements for Roads and Bridges program, 2,055 county bridges were deemed substandard during the last inspection cycle. The cost to repair or replace them would be approximately $800 million, the Oklahoma Department of Transportation estimated.
Eighty-five percent of all structurally deficient bridges in Oklahoma were on the county transportation system in FY 2019.
LOFT found that 86% of Oklahoma’s structurally deficient bridges are more than 50 years old, and that county bridges typically are not engineered to last as long as ODOT-designed bridges, which have a 70- to 80-year lifespan. “For example, 69 county bridges built within the last 20 years are already classified as structurally deficient,” the legislators reported.
According to the National Bridge Inventory, approximately a dozen structurally deficient bridges in Oklahoma were constructed prior to statehood in 1907, and more than 1,050 were built in the 1940s.
A regional (nine-state) comparison found that Oklahoma ranks first in both total number and percentage of structurally deficient county bridges. Oklahoma has more structurally deficient county bridges than Arkansas, Colorado, Louisiana, New Mexico and Texas combined, the LOFT analysis discovered.
In FY 2020 the Legislature made a combined investment of $386 million to maintain and improve county roads and bridges.
Between FY 2008 and FY 2020, 56% of CIRB’s funds were spent on roads and 44% were devoted to bridge reconstruction projects, records reflect.
When the CIRB was created 16 years ago, it was not intended to be the sole funding source for replacing structurally deficient bridges, but rather a tool to accelerate the effort, the legislators wrote.
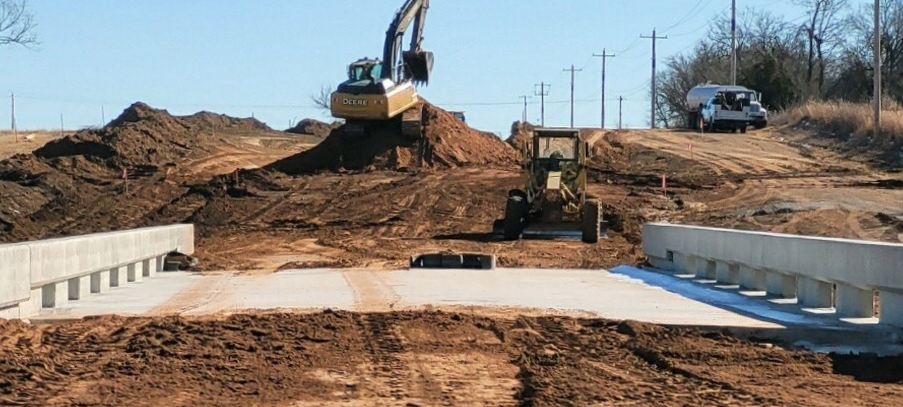
To repair or replace
deficient a county bridge
requires a lot of money
However, LOFT determined that, on average, the estimated cost to repair or replace each structurally deficient county bridge in 2019 was $324,640. The Legislature’s yearly $120 million apportionment averages $48,058 per bridge, or about 15 cents for every dollar needed for county bridge construction projects.
CIRB funds are apportioned in equal amounts of up to $15 million to the state’s eight transportation districts. LOFT’s analysis found that the current CIRB funding formula “fails to account for areas of greatest need or greatest concentration of infrastructure, either for number of county bridges or total county road mileage.”
As an illustration, Transportation District 3 (Lincoln and Seminole county region) has 538 structurally deficient bridges, District 4 (Garfield/Kingfisher/Logan region) has 529 and District 8 (Tulsa region) has 511. In comparison, District 6 (Alfalfa County area) has 120, District 5 (Washita County region) has 163, and District 7 (Comanche/Caddo/Stephens/Grady region) has 247 structurally deficient bridges.
Consequently, the annual available funding per bridge has ranged from $28,000 to $125,000 because of the equal apportionment of CIRB funds to the eight transportation districts without factoring in need or density of structures, LOFT noted. Legislation that went into effect last July adjusted one-fourth of the CIRB apportionment formula to be distributed directly to counties with the greatest infrastructure needs.
A report from the State Transportation Commission pegged county road mileage in FY 2019 at 82,822. Consistent with the CIRB funding formula of equal apportionments to districts, counties received an average of $1,720 per county road mile that year. However, 11 counties received less than $1,000 per mile; Texas County, for one, had the highest county road mileage at 2,493 miles, but received the least amount of funding: $668 per mile.
During a 2020 interim legislative study of the CIRB, county commissioners said that for every mile of county road it costs, conservatively, $150,000 for asphalt overlays or $25,000 to $30,000 for gravel paving.
Since creation of the CIRB in 2006 by the Legislature, $1.3 billion in county projects have been completed, ledgers reflect.
Even so, the Legislature raided the CIRB three times (2015, 2017 and 2018) to help plug state budget gaps, siphoning off $230 million that county commissioners had accumulated for county road and bridge repair and replacement projects. The lawmakers restored a total of $50 million of that in 2020 and 2021.
Substandard bridges
on school bus routes
Oklahoma’s county transportation system consisted of 82,959 road miles as of New Year’s Day 2021, according to Randy Robinson, executive director of the Oklahoma Cooperative Circuit Engineering District Board. The county system includes 4,911 city street miles in 521 communities, LOFT reported.
The county transportation network constitutes 70% of Oklahoma’s road/highway system and almost 59% of all bridges. Yet it is a low-traffic system, carrying an estimated nine percent of the state’s traffic volume.
However, the members of LOFT learned that in 2019 Oklahoma had 1,070 bridges classified as school bus critical, an ODOT designation for bridges determined to be critical safety concerns because their load-bearing capacity has been lowered to 15 tons or less.
More than 382,700 students – 59% of the children enrolled in grades K-12 in FY 2021 – rode on school buses each day during that school year, according to the State Department of Education.
School bus critical bridges in southwest Oklahoma in 2019, ODOT data showed, included 25 in Comanche County and 27 in Caddo County; Stephens County, 13; Jackson and Jefferson counties, nine each; Tillman County, eight; Kiowa County, seven; Cotton County, four; Greer County, three; and Harmon County, none.
LOFT’s analysis determined that the average traffic volume across county bridges in Oklahoma is 162.2 vehicles per day.
In addition to the potential safety hazards for all motorists who cross a structurally deficient bridge, the condition of those structures can affect commute times and fuel costs for school districts.
For example, Gypsy school district in Creek County reported having to detour 20 miles because of a structurally deficient bridge on their school bus route, ultimately adding 30 additional minutes of travel time. This equates to an extra 200 miles and more than five hours of additional travel time each week, LOFT pointed out.
Wellston school district, in Lincoln County, identified four structurally deficient bridges on their bus routes that added 19 miles and an additional 38 minutes to their bus routes.
The LOFT analysis found that it costs approximately 81 cents per mile to operate a school bus, based on maintenance, fuel and depreciation costs. Therefore, using data received from five school districts that reported eight structurally deficient bridges on their bus routes, the total estimated cost of detours caused by those bridges was $15,163 for the 2019-20 school year.